Creative Thinking
From Stats to Stories: The Evolution of Data Storytelling
By Taylor Holland on March 20, 2019
To share data, or to share stories? If that is the question for content marketers, the answer is a resounding "both." Better yet, brands that embrace data storytelling can do both at the same time.
Data and stories have long been considered opposites-opposite ways of making a point, opposite ways of appealing to audiences, opposite ways of thinking. This faulty logic permeates the left-brain/right-brain myth, the idea that someone is either creative or analytical, good with words or good with numbers-not both. Thankfully, that theory has been debunked, because as modern content marketers know full well, the job now requires both creative thinking and analytical thinking, both numbers and narratives.
In fact, stories and data are better together. One makes an emotional connection, and the other earns trust. One paints a picture, the other grounds that picture in reality. It's one thing to say, "Childhood hunger is a problem in the U.S." It's another to say, "One in six children in the U.S. are unsure of where they'll get their next meal from."
On the flip side, numbers aren't very compelling unless they answer the question, "So what?" That's why Amazon founder and CEO Jeff Bezos has banned PowerPoint presentations from executive meetings. Instead of having fellow employees read slides full of stats and bullet points while listening to someone drone on and on, everyone sits silently and reads a "six-page memo that's narratively structured with real sentences, topic sentences, verbs, and nouns." Then, they discuss it.
Data and storytelling each have their advantages and disadvantages for content marketers, and sometimes it only takes one or the other to make a point. But these days, brands don't have to choose. Today's global brand leaders are embracing the strengths of both data and description in their branding more than ever. Learn how leading marketers make content that captivates audiences in Skyword's Top Hacks to Becoming a World-Class Brand Storyteller Ebook.

As data analytics in marketing becomes increasingly advanced, brands now have tons of great data at their disposal to power their content marketing. Marketing leaders have a deep understanding of who their customers are, how they're using products and services, why they're using them, and how they'd like to use them in the future. All that data provides great insights, but it can also serve as the backbone of a great story.
What Is Data Storytelling?
Combining data and stories is a winning formula for marketers. When comparing text-only articles to those that contain charts or infographics, infogram found that stories with data visuals received 34 percent more social engagement, with 20 percent more readers scrolling all the way down the page on those stories.
But this method of storytelling isn't as simple as adding a few charts and graphs to illustrate a point. Instead, the data is the starting point, and the story emerges from there. So what does it actually mean? The term is still fairly new, and it's evolving as different organizations and business functions begin to rely more heavily on data to make or influence decisions. TechTarget, for example, defines telling stories with data as "the process of translating data analyses into layman's terms in order to influence a business decision or action."
Telling stories through data internally, is a primary goal for any marketing department looking to make data more meaningful, more relatable, and more actionable to their executive boards. Thankfully, marketing analytics tools like TrackMaven's data storytelling features automatically create data-backed narratives for marketing performance with executive-friendly dashboards and reports that align your marketing team around a uniform view of your business from social buzz to revenue.

But for content marketers, data stories should do more than just influence decisions, they should engage audiences, share information they couldn't get anywhere else, and answer the all-important question, "So what?"
Gartner offers a useful perspective for content marketers: "Data stories explore and explain how and why data changes over time, usually through a series of linked visualizations. Although visualization is almost always a key element in data stories, it is only one piece of a three-part strategy."
That three-part strategy, according to Gartner Senior Director Analyst James Richardson, includes the critical components of any good story-a beginning, middle, and end. "However, the end should never be a fixed event, but rather a set of options or questions to trigger an action from the audience."
Simply put, this method of storytelling is like data visualization, but with a clear purpose, a compelling narrative, and an open ending which encourages audiences to think critically and form their own conclusions.
4 Ways to Tell Data Stories
Data storytelling is proving to be a major advantage for marketers in 2019. A quick Google search of the term will yield article after article proclaiming such, as well as thousands of posts about upcoming workshops, conferences, and college courses on the topic. The Massachusetts Institute of Technology even has a Data Storytelling Studio course.
Brand storytellers are also getting in on the trend, using data stories to do four key things:
1. Celebrate the Customer Relationship with Personalized Stories
Everyone loves a good story, especially when it's about them. And a personalized data story is even better. It's also a good way for brands to encourage audiences to share data with them, knowing it will be put to good (or at least creative) use.
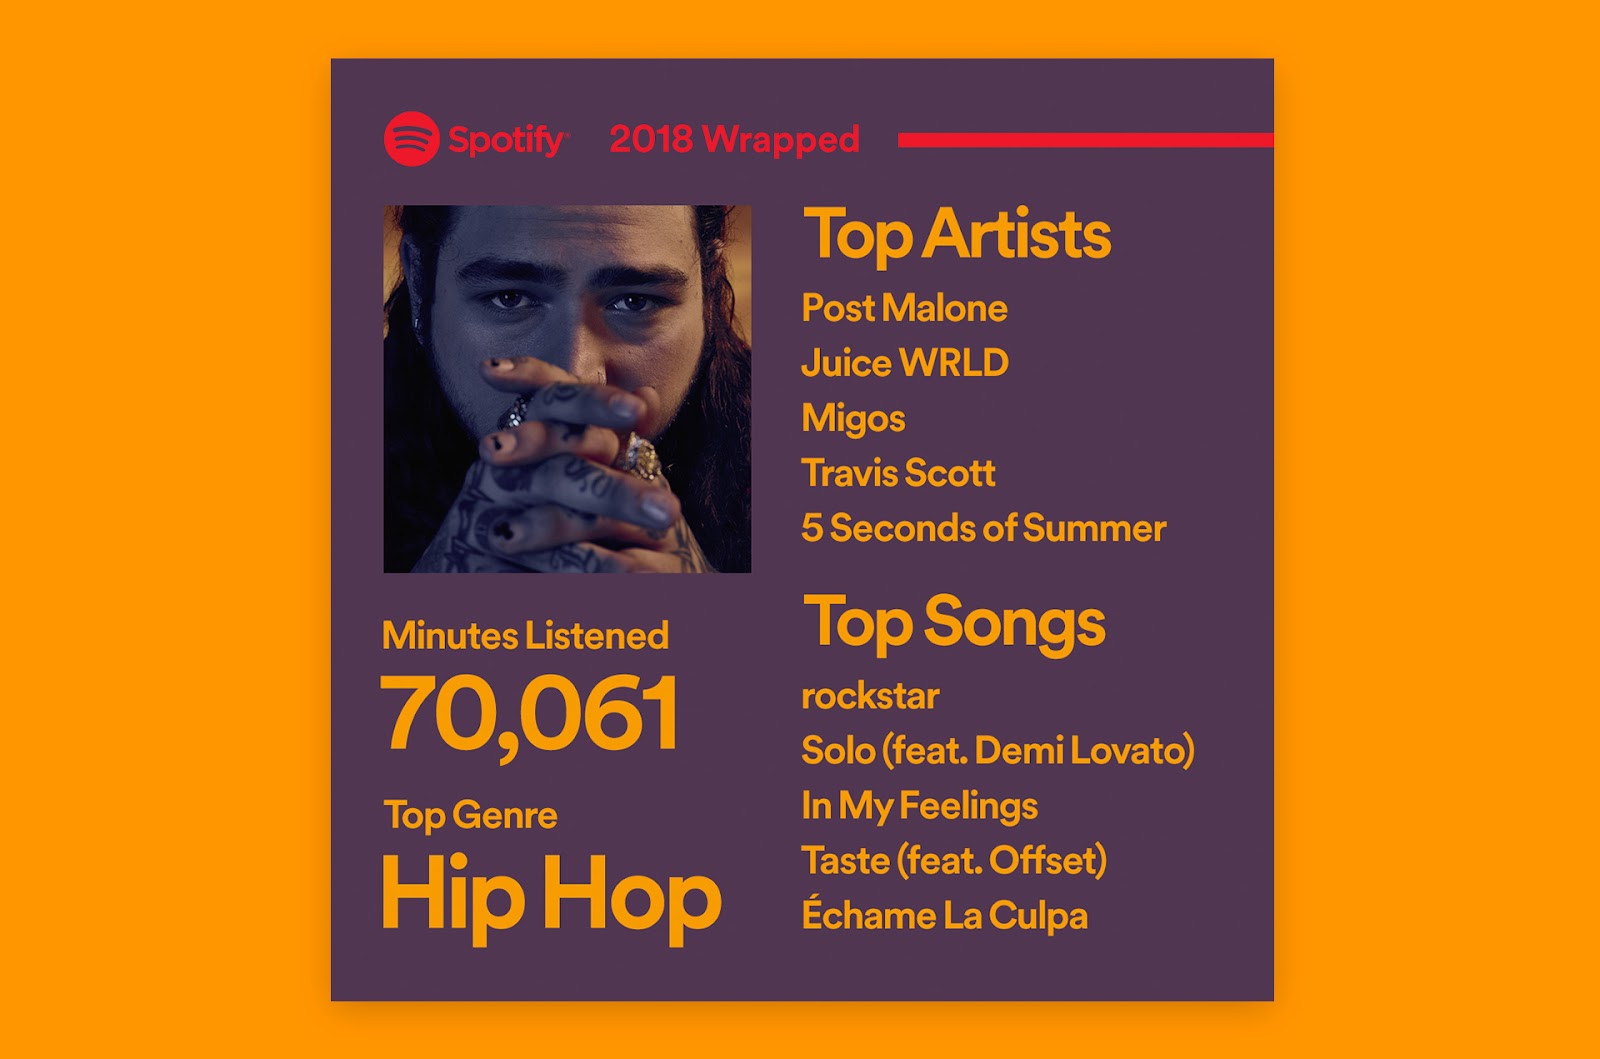
To thank its audience for all the rich data they provide, Spotify wraps it and gifts it back to them at the end of each year through the annual Wrapped campaign. Last December, every Spotify user received an email prompting them to log in to the site to enjoy a customized, interactive experience which includes data about total minutes streamed as well as the most-played songs, artists, and genres.
Along with this walk down memory lane, Premium users got extra data and perks, including the chance to have their Wrapped share card featured on digital billboards in New York City's Times Square, London's Piccadilly Circus, among other iconic locations.

Some lucky users even received direct mail, including a personalized puzzle of their top artist for the year.

Granted, Spotify has a data analytics advantage, and as a music streaming service, a unique opportunity to make an emotional connection. But with more and more streaming channels entering an already-crowded market, Spotify's ability to develop personal relationships with its massive audience is impressive-and definitely no easy feat.
2. Turn the Customer Experience into a Data Story
Some brands use data to engage their audiences; for others, data is what customers are paying for. Either way, a good story makes the data more meaningful, and therefore more valuable.
For example, with the Nationwide Retirement Readiness experience, the customer interface is a data story in itself. As with most online banking tools, Nationwide users can see exactly how much they have saved for retirement, but rather than just adding a retirement calculator tool, the insurance and financial services company uses charts and graphs to show exactly how much customers can expect to receive in retirement (based on their current rate of savings), how much they'll actually need (based on their personal data), and how far they are from their goal. Each customer's profile also includes prompts with personalized suggestions about how to save more.

These personalized data stories have a start, middle, and are open-ended, with Nationwide playing a powerful supporting role to their customers-during each and every phase-as they become the heroes of their own financial future.
3. Simplify Complex Data with Visual Storytelling
Brands aren't the only ones telling data stories. Governments are using this strategy as well, simplifying complex data sets that citizens want and need, but in a more digestible format.
In Washington D.C., the District Department of Transportation launched an interactive website that displays and summarizes traffic data to help commuters understand where and when traffic congestion is most problematic. But that District Mobility Project isn't just a bunch of maps with red and orange lines indicating heavily congested roads, the site breaks down data into "stories" (their word for it) about all types of commutes, including personal vehicles, public transportation, walking, biking, and more. Within each story, citizens can find stats, graphs, and key insights about how to improve their daily travel time.

It's not too often that we see a government entity become a digital trendsetter, but brands should take notice of movements like this.
4. Connect the Brand to Customer Challenges
For B2B brands in particular, the key to engaging audiences and winning their trust is to demonstrate a deep understanding of their challenges. And it doesn't hurt to back up those claims with original data.
That's what Cisco has done with its DNA in Mobility microsite, proving that even product promos work better with data stories. Site visitors are asked to indicate whether they are wireless users or IT users. Then, they can explore three different stages of a mobile strategy: insight and experience, automation and assurance, and security and compliance. Clicking on each stage reveals compelling data points, as well as checklists and product suggestions.

These are just some of the ways that brands are embracing advanced data analytics in marketing to tell powerful stories. And with this method of storytelling proving to be the hot trend for 2019, it's safe for marketers to expect to see even more of it in 2020. So if you're looking to turn up the volume with your brand storytelling this year and in the future, too, don't forget the data!
Find out more about how to turn insights into unforgettable marketing stories by downloading our Ebook, Top Hacks to Becoming a World-Class Brand Storyteller! Download here.
Featured image attribution: Matias Islas